
Product · Supply chain
Demand Planning & Forecasting
Forecast demand at item and location level, so inventory, production and replenishment plans rest on more than gut feel.
Most planning still runs on spreadsheets, averages and experience. That works until the range grows, demand gets patchy or stock sits in the wrong place. Our planning tool turns your sales and stock history into a forecast for every item at every location. It then shows what to buy, what to move and what to stop buying, with the reasoning behind every number.
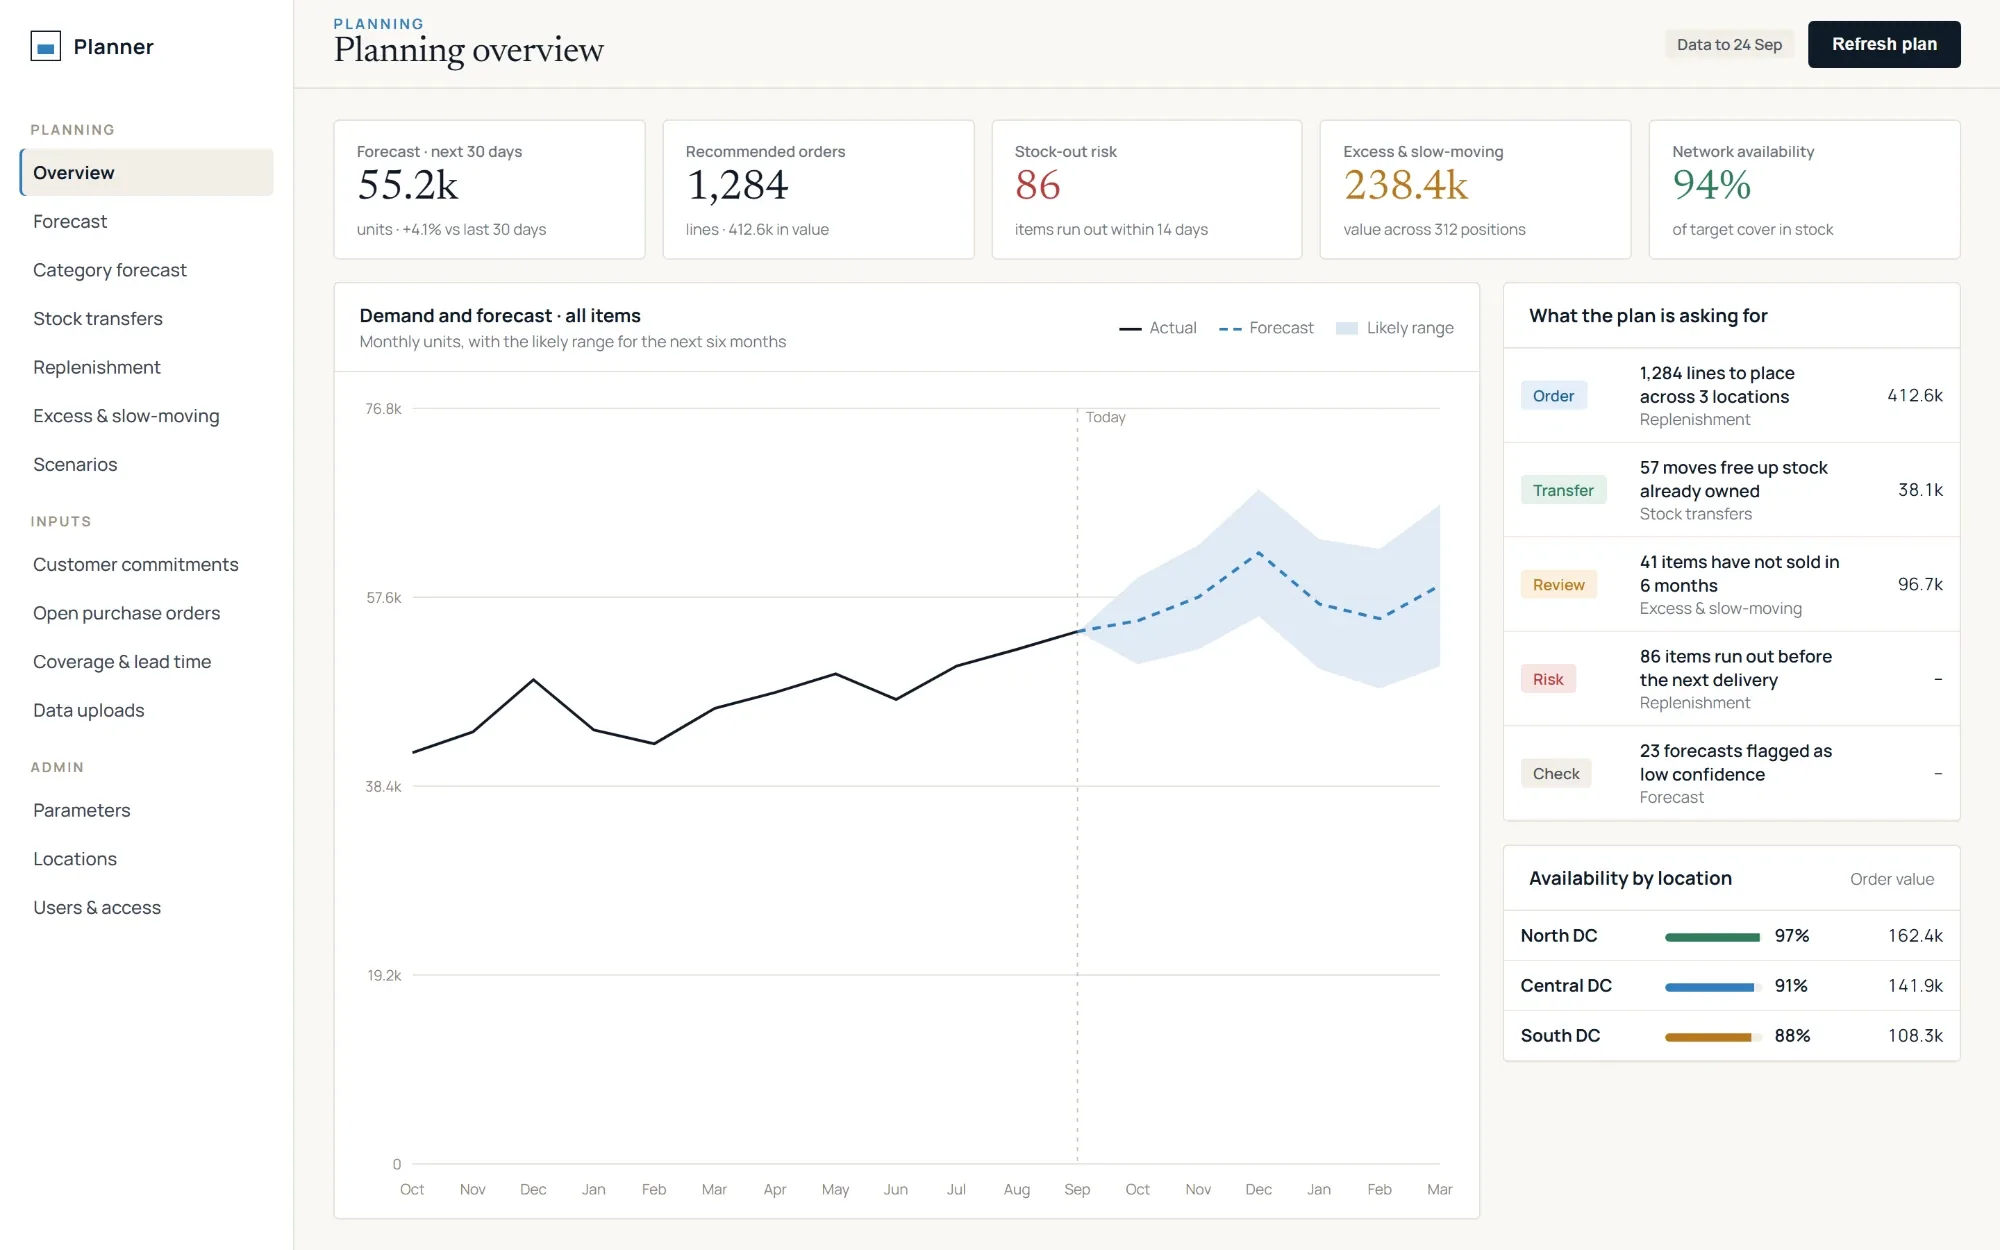
Planning overview: Forecast, orders, stock-out risk and excess stock across the whole network, and what the plan is asking for. Screens show sample data.
What it does
Forecasts that fit each item
Not every product sells the same way. The tool reads each item's demand pattern, whether steady, erratic, occasional or seasonal, and picks a suitable forecasting method for it automatically. New items and slow sellers are handled on their own terms instead of being forced into one model. Every forecast comes with a likely range, not just a single number.
Replenishment you can explain
Order suggestions follow simple, visible rules. They take forecast demand over the cover period and lead time, add committed customer orders and a safety buffer, then subtract stock on hand and stock already on order. Planners can open any line and see exactly how the number was reached.
Stock in the right place
Before suggesting a purchase, the tool checks whether another location holds surplus of the same item. It proposes a transfer first, so money isn't spent on stock the business already owns.
Excess and slow-moving stock, flagged early
Items that have stopped selling, or where stock far exceeds need, are surfaced with their value. Each one gets a decision, and new orders for them are held back.
Planners stay in control
Coverage targets, lead times and service levels are set by the people who own them, by location and by item importance. Any forecast or order can be overridden with a reason, and every change is logged.
What-if scenarios
Test a different plan before committing to it and see its effect on stock cover and availability. Then apply it, or discard it.
Works with the tools you already use
Data comes in from any ERP or system as standard spreadsheet or CSV exports. Plans go back out to Excel with the calculations left in place, so teams can review, adjust and share them.
Inside the tool
See how it works.
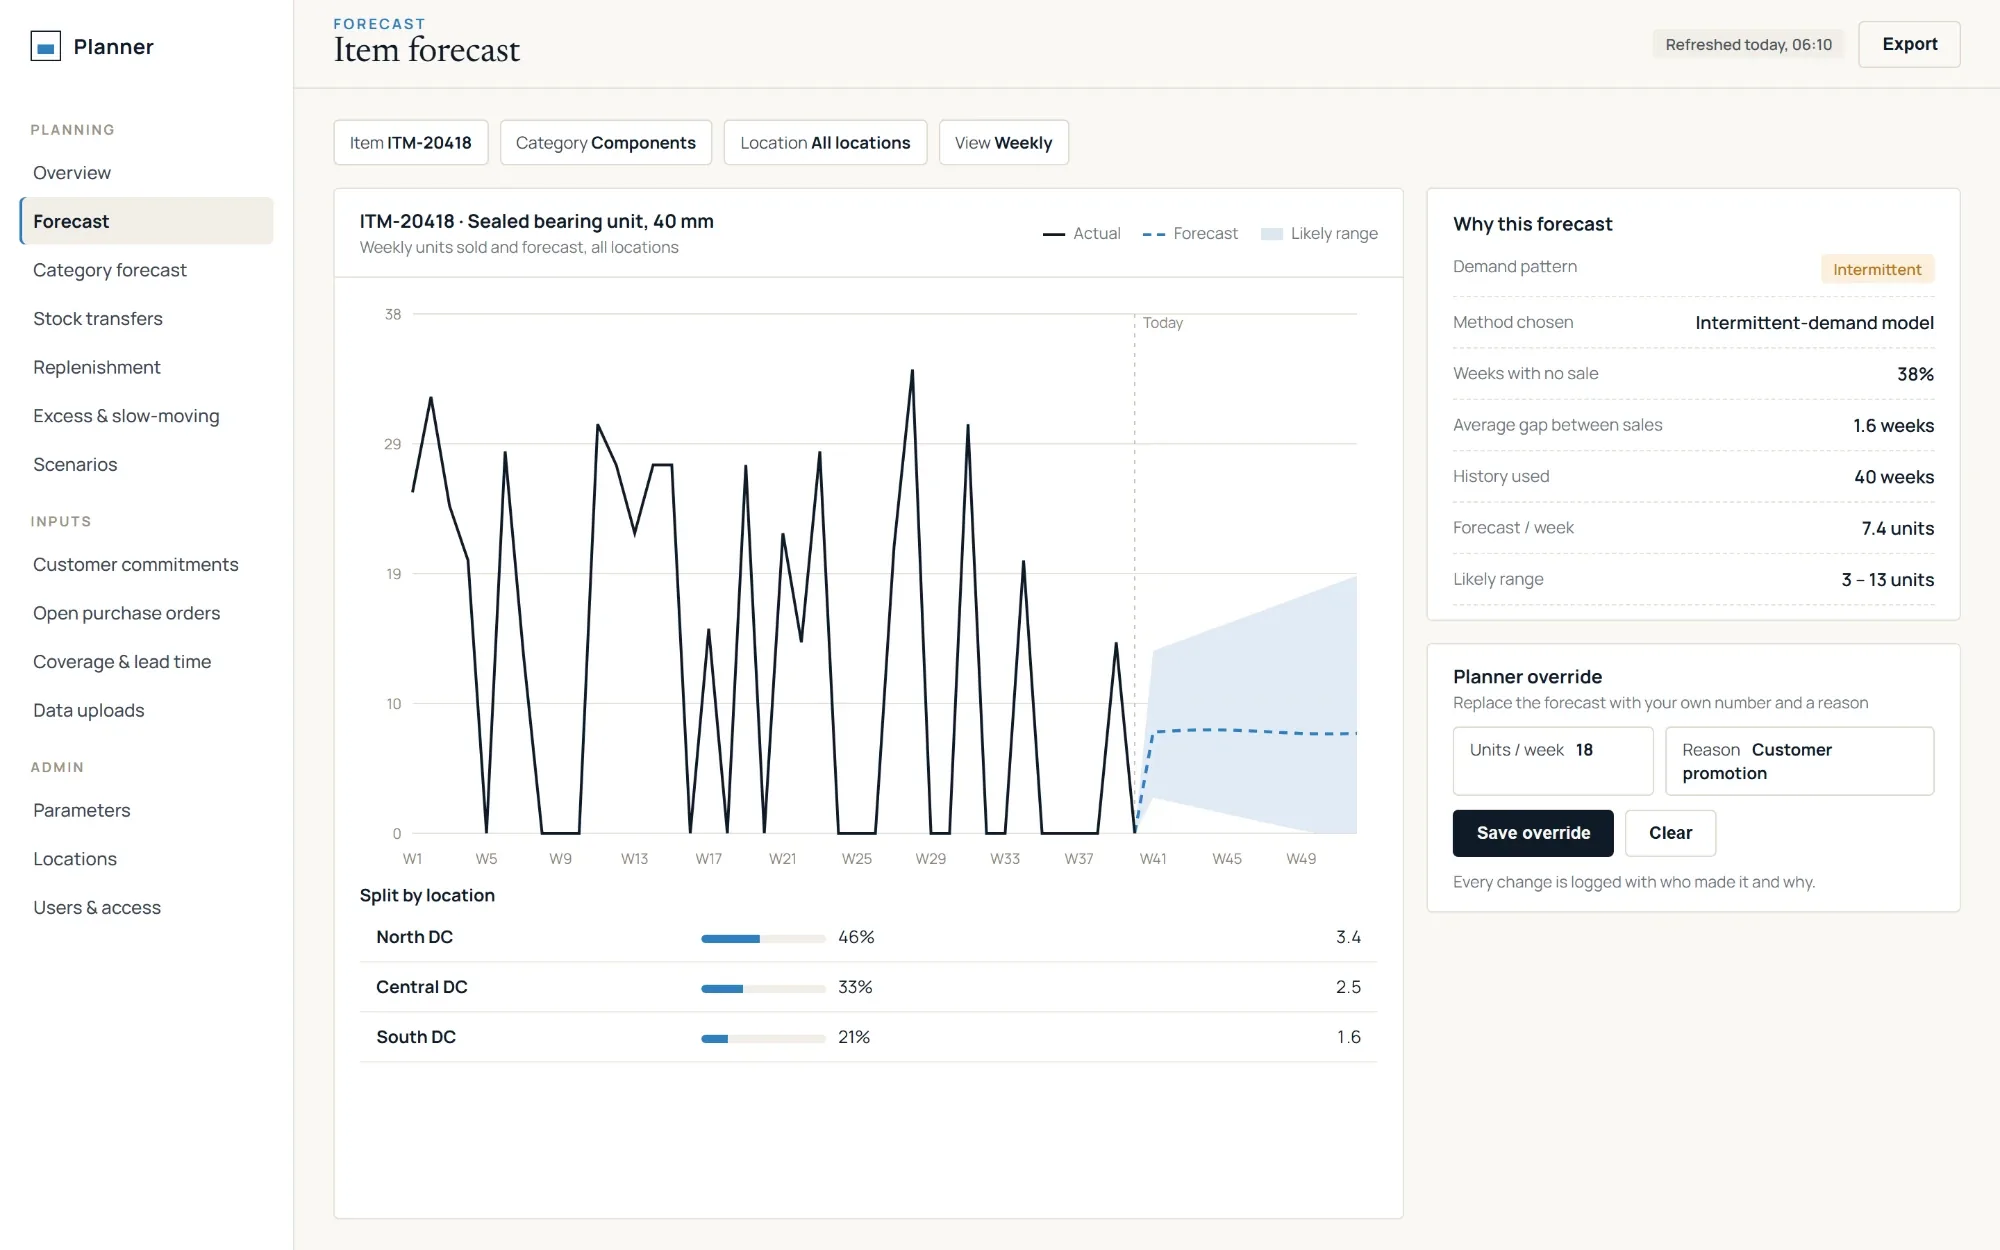
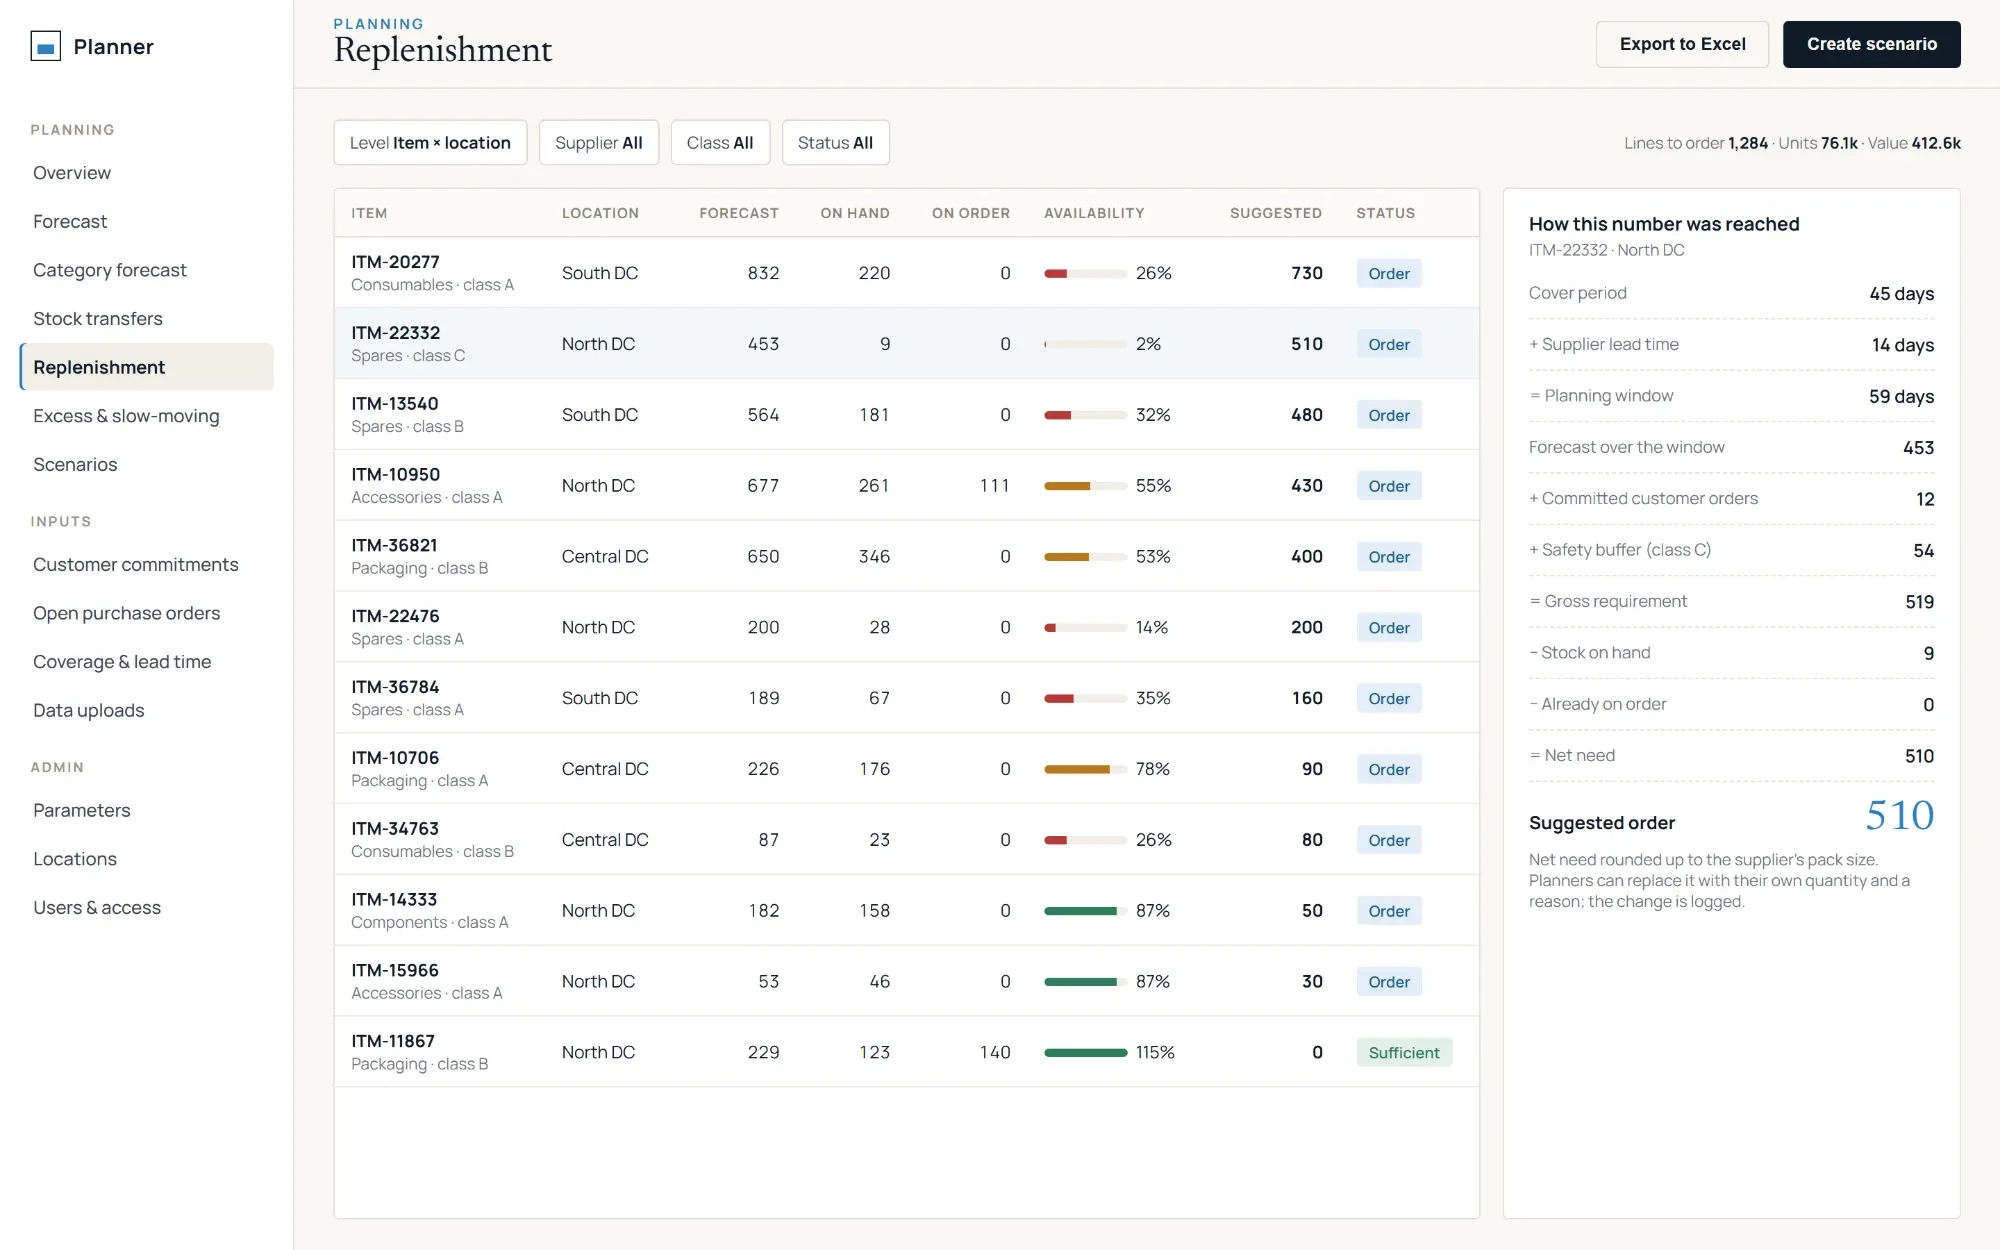
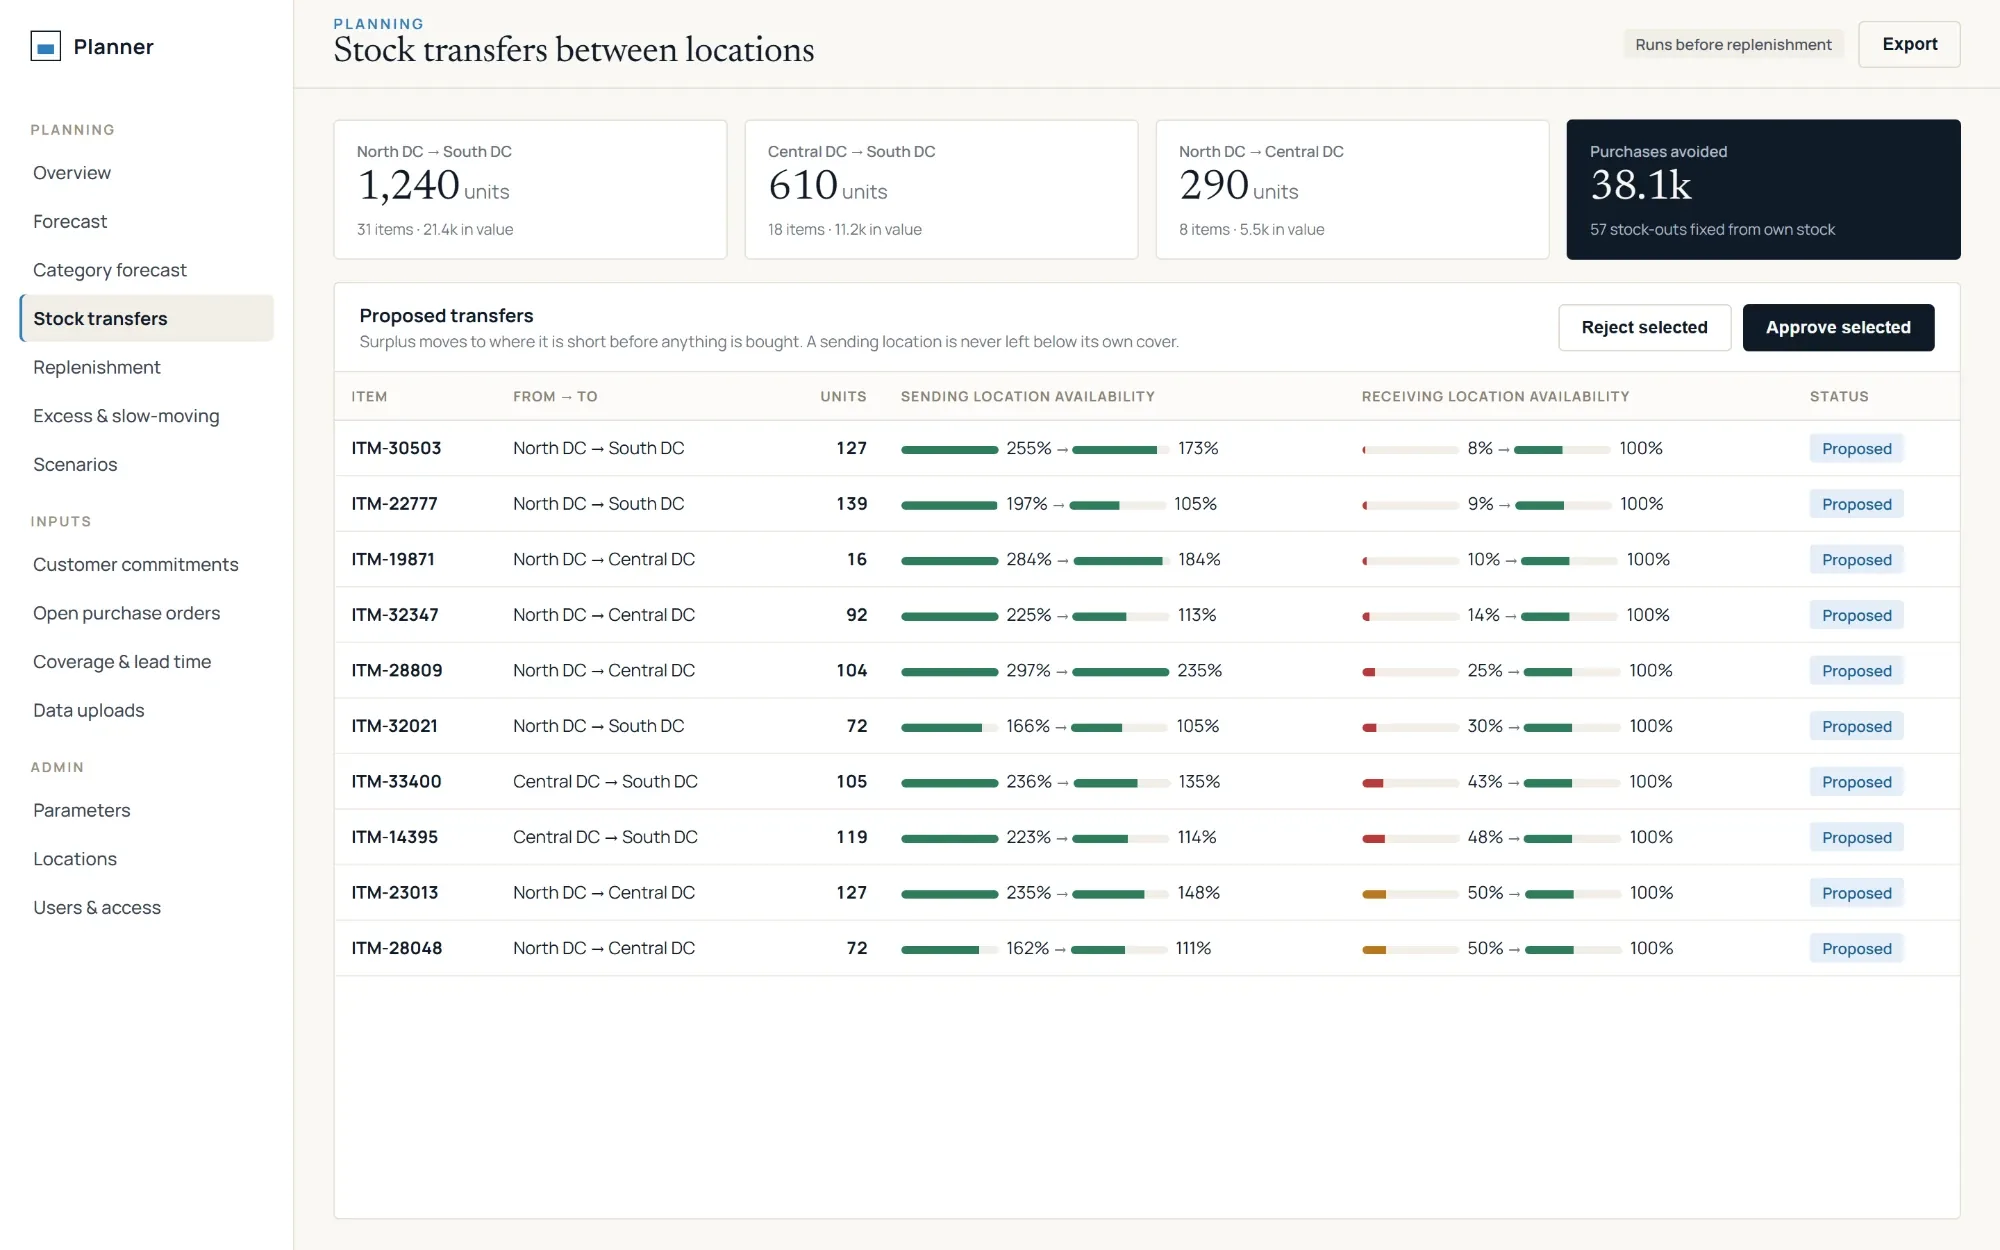
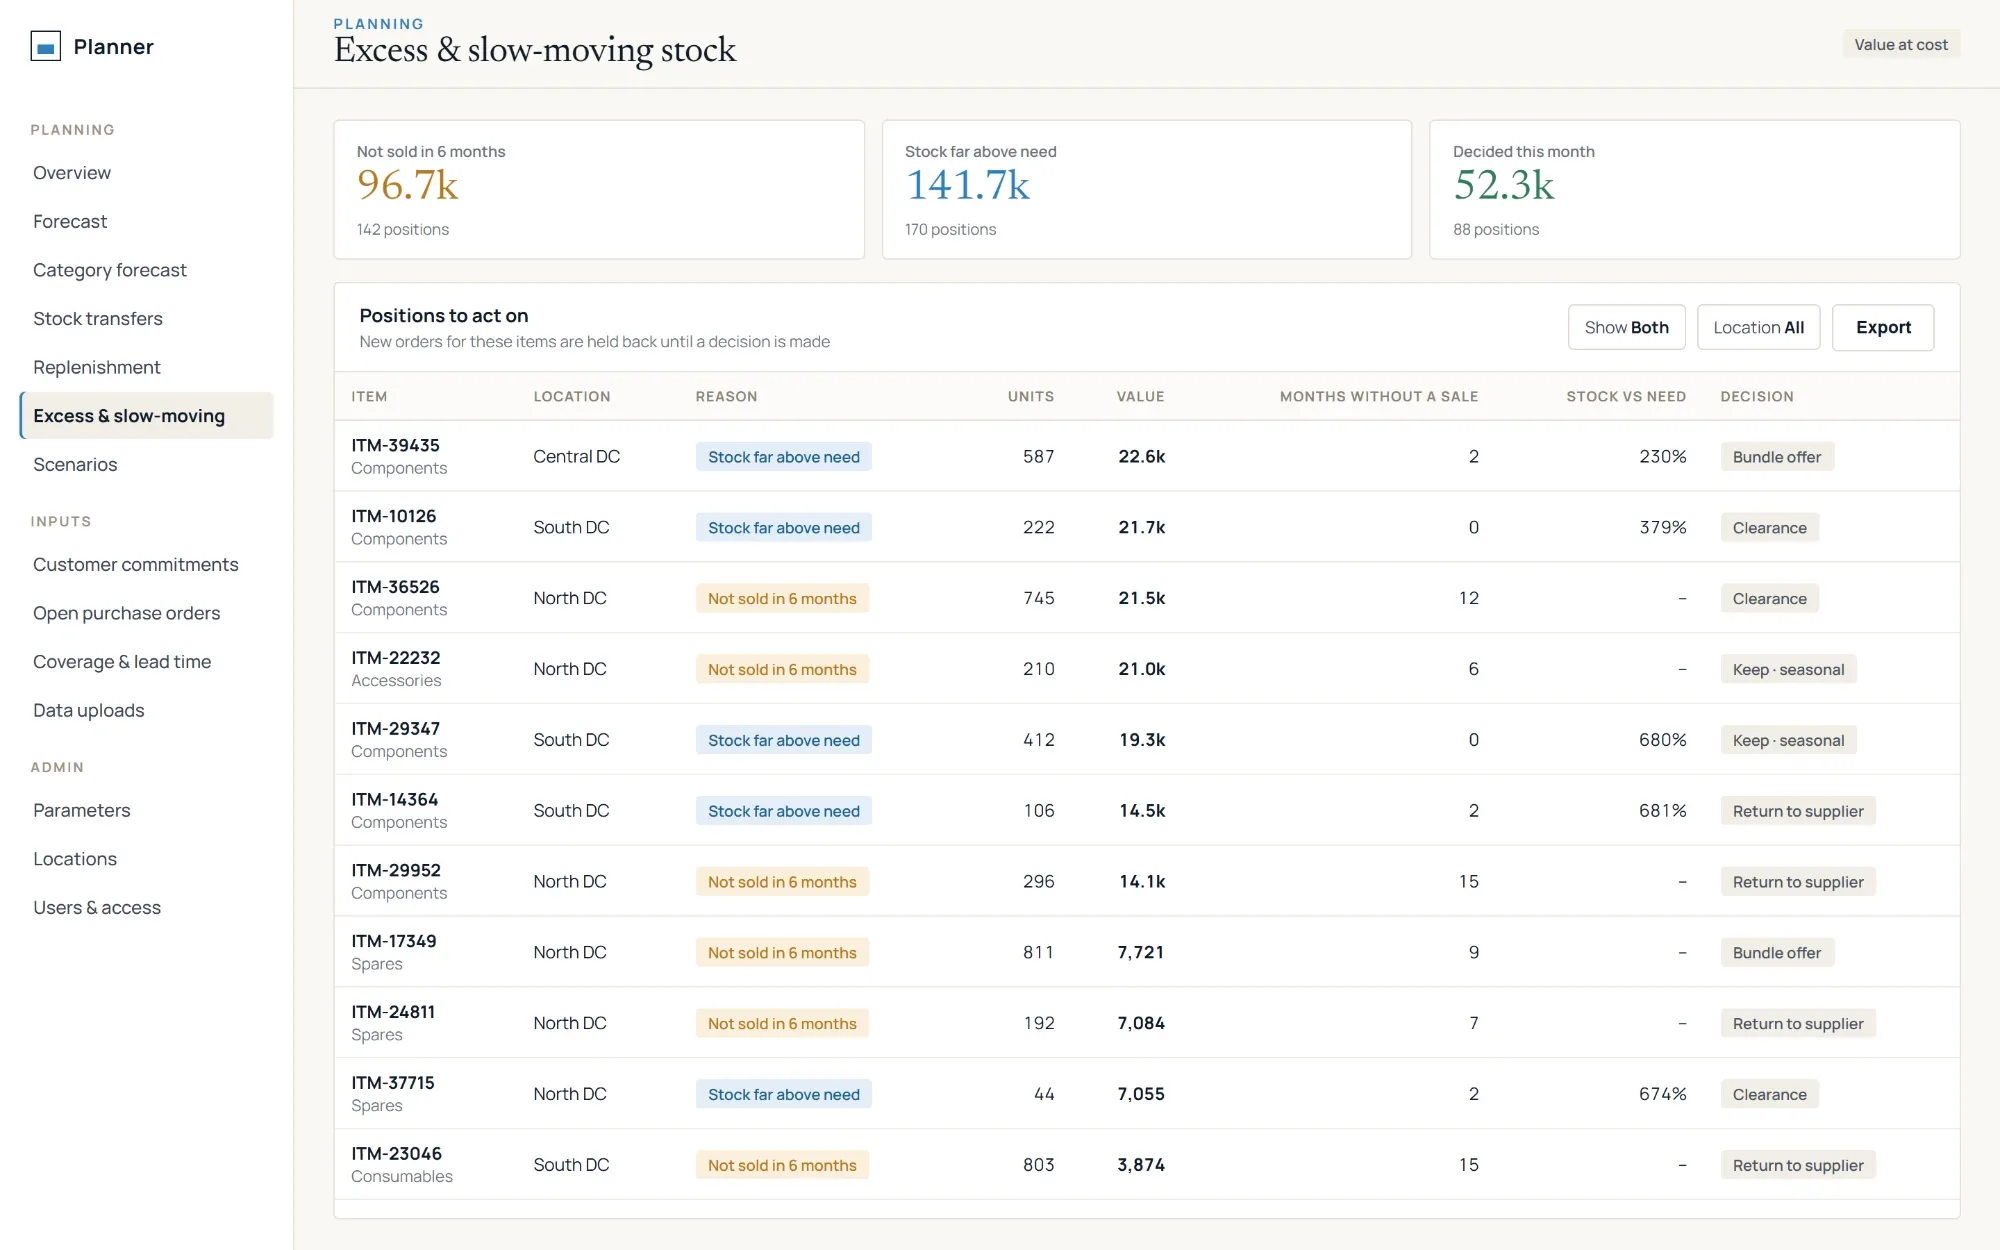
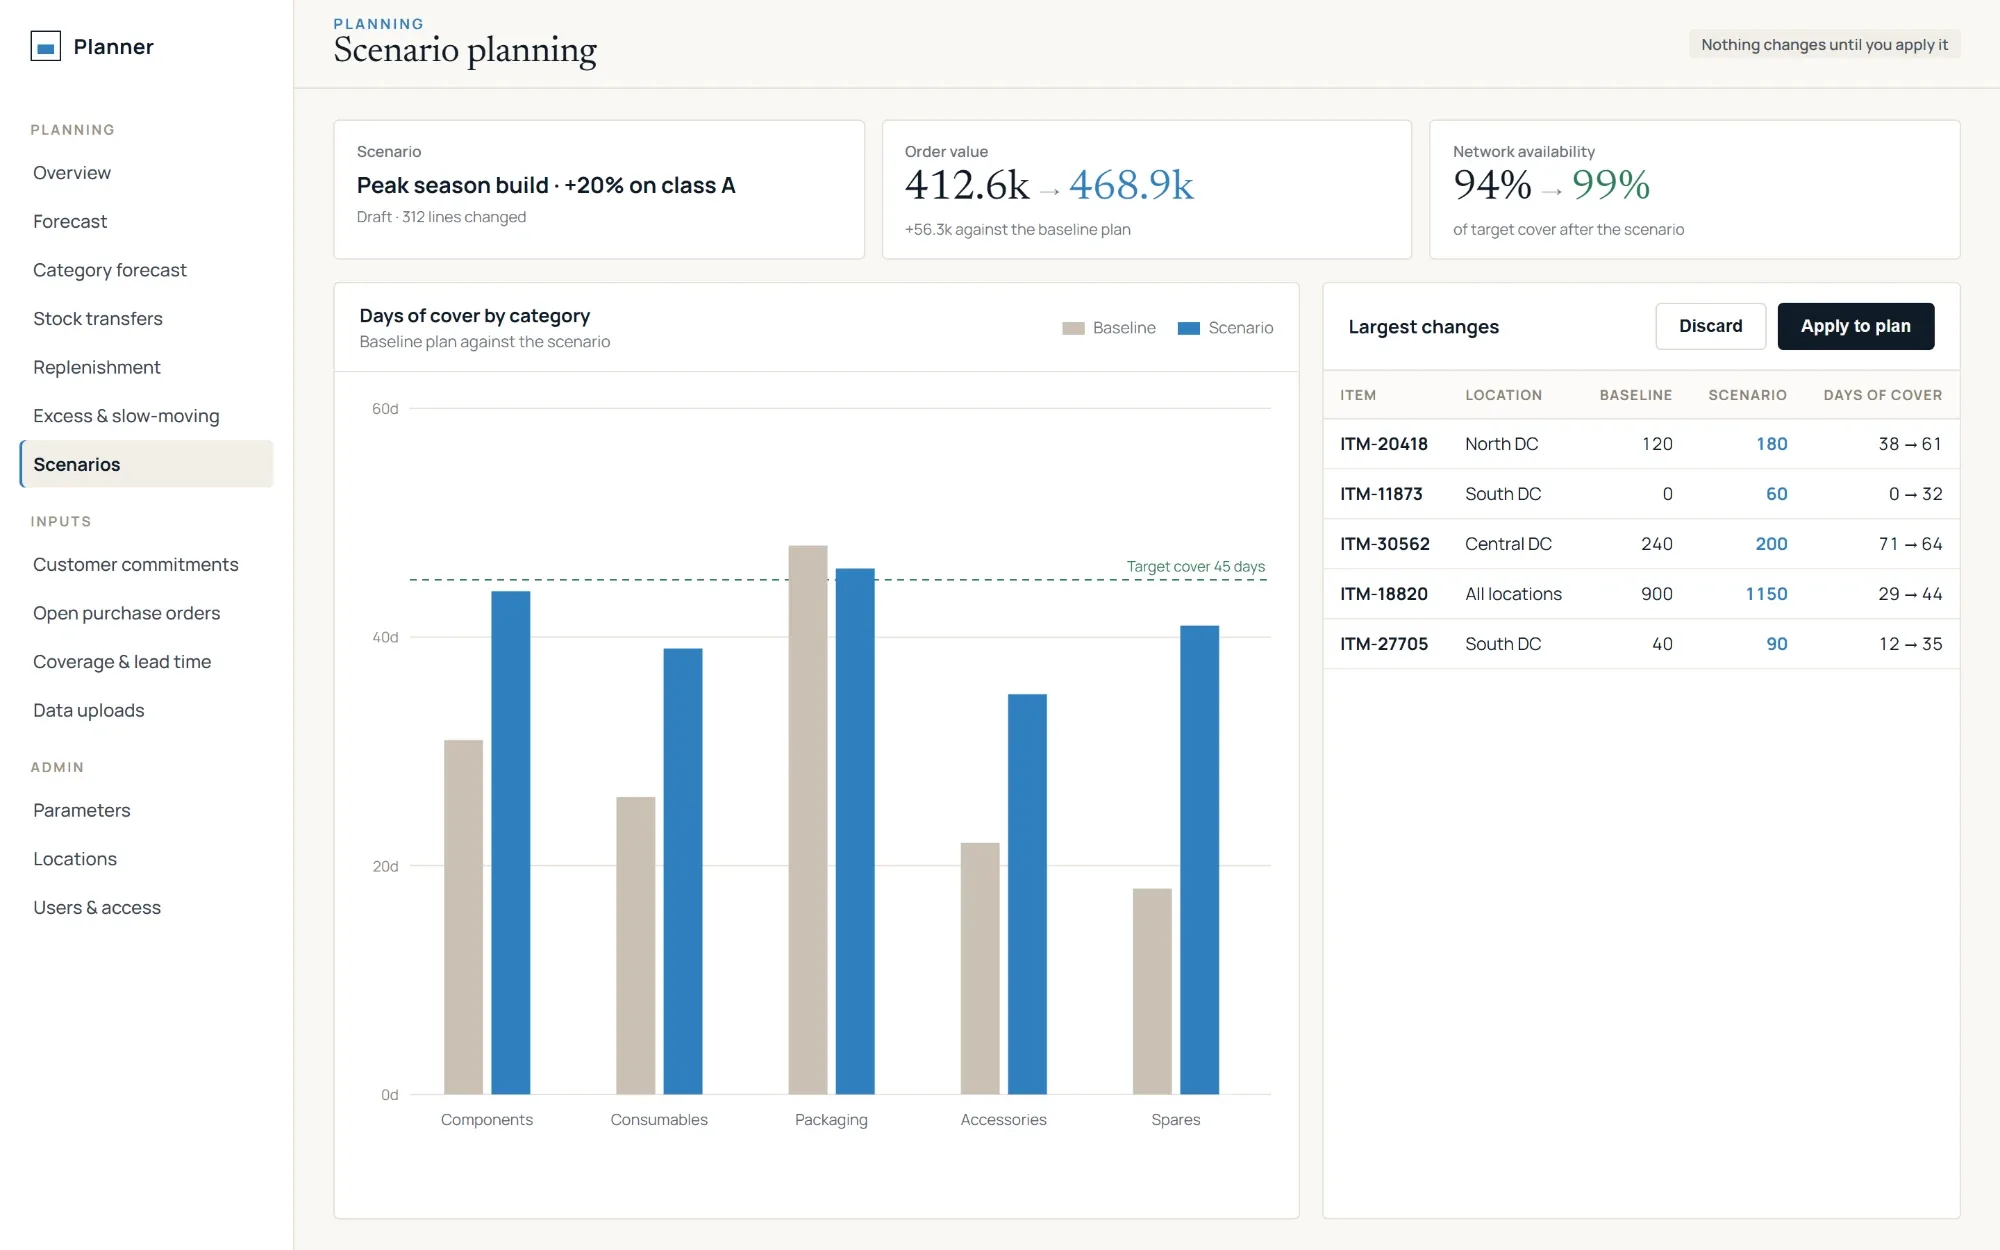
Screens show sample data. Click any screen to enlarge it.
Works across industries
The engine is industry-agnostic. We configure the item categories, locations, planning rules and roles to match how your business works. It suits any business that holds stock across one or more locations:
- Distribution and wholesale
- Retail and e-commerce
- Consumer goods and FMCG
- Spare parts and aftermarket
- Healthcare and pharmacy supply
- Food and beverage
What you get
- One view of demand and stock across every item and location.
- Fewer stock-outs, because gaps are seen before they happen.
- Less cash tied up in stock, because excess is flagged and existing stock is used first.
- Faster planning cycles, because the arithmetic is automated and planners spend their time on decisions.
- Numbers people trust, because every recommendation can be traced and explained.
Getting started
Configured to your business. Yours to own.
- 01
Discovery
We look at how you work today and the data you have.
- 02
Configure and prove it
We set it up on your data and measure it against how you work today.
- 03
Roll out and hand over
Your team is trained, and what we deploy is yours.
Request a demo
See it on a problem like yours.
Tell us a little about your business. We'll get back to you within 24 hours.